Traffic
Traffic Module
How to
The module allows you to collect Accounting data from Mikrotik equipment. Thus, you can see from what type of IP address to which type of IP address did the data go or were received and in what quantity. In order for the module to work it is necessary to make sure that it is installed and running in Settings:
Jobs
When you click on the Jobs tab, you will see the following window:
There are 4 buttons on the Jobs tab:
 - Add traffic job
 - Delete traffic job
 - Take accounting snapshots from the current group
 - Take accounting snapshots from all group
Add traffic job
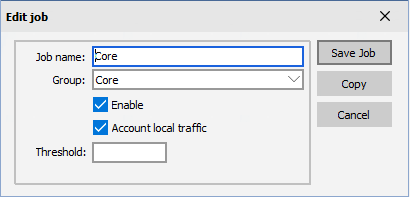
In order for the program to collect data from your routers, you must click on the ![]() , then the Edit job window will open:
, then the Edit job window will open:
- Job name - name of the job
- Group - select a group of routers from which we want to collect data
- Enable - whether local IP traffic accounting is enabled
- Account local traffic - whether to account the traffic to/from the router itself
- Threshold - maximum number of IP pairs in the accounting table (maximal value is 8192)
After clicking on the Save Job button, the program will automatically collect data from routers and save them to the database. In the Free version, data collection is limited to 7 days and 3 routers.
Traffic Snapshots
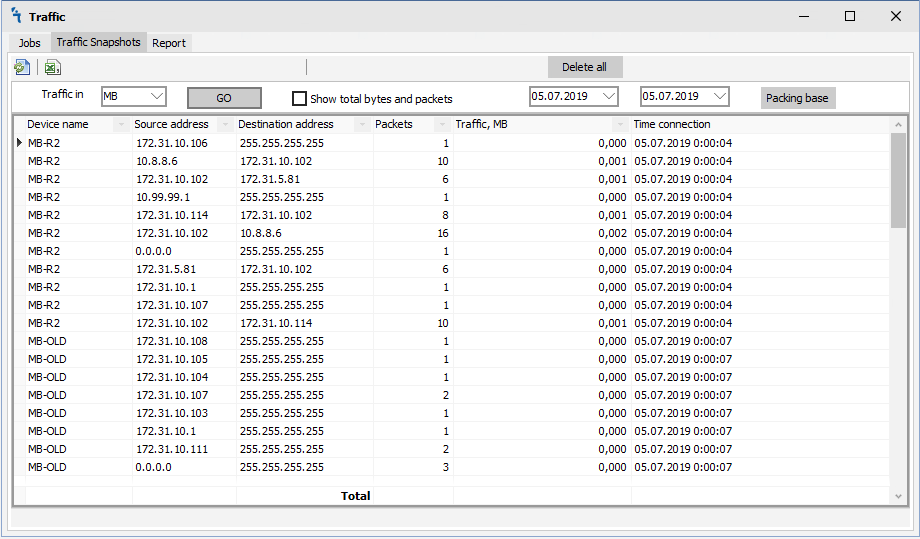
When you click on the Traffic Snapshots tab, you will see the following window:
There are 2 buttons on the Traffic Snapshots tab:
In the Traffic Snapshot tab we see all the data that the system collected from all devices that were included in the collection group. The toolbar has the following:
- Traffic in - Display traffic in Bytes, Kb, MB, GB
- Button GO - Refresh traffic snapshots history
- Show total bytes and packets- When choosing, you will see the total for packets and traffic below.
- Select date from to - to filter data by date
- Packing base Button - packs database data by day
- Button Delete all - Delete all data from the database
Report
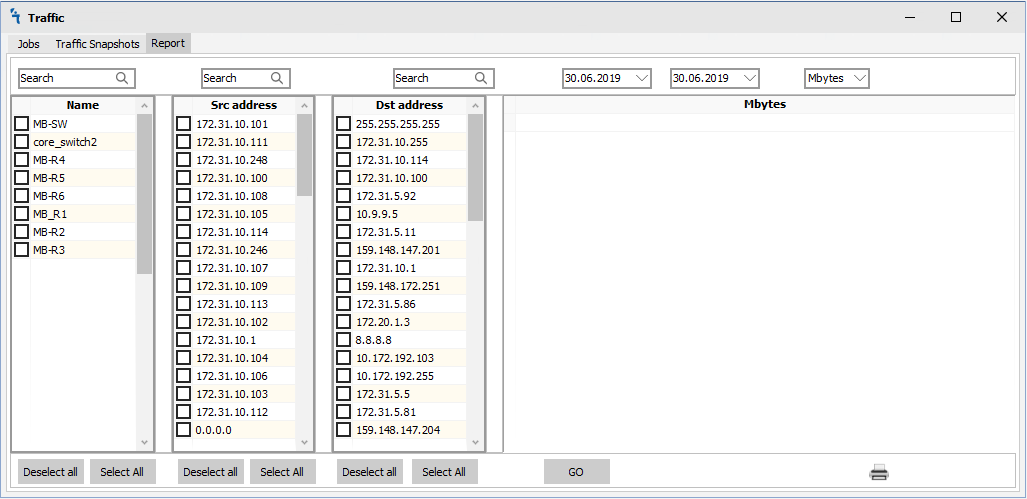
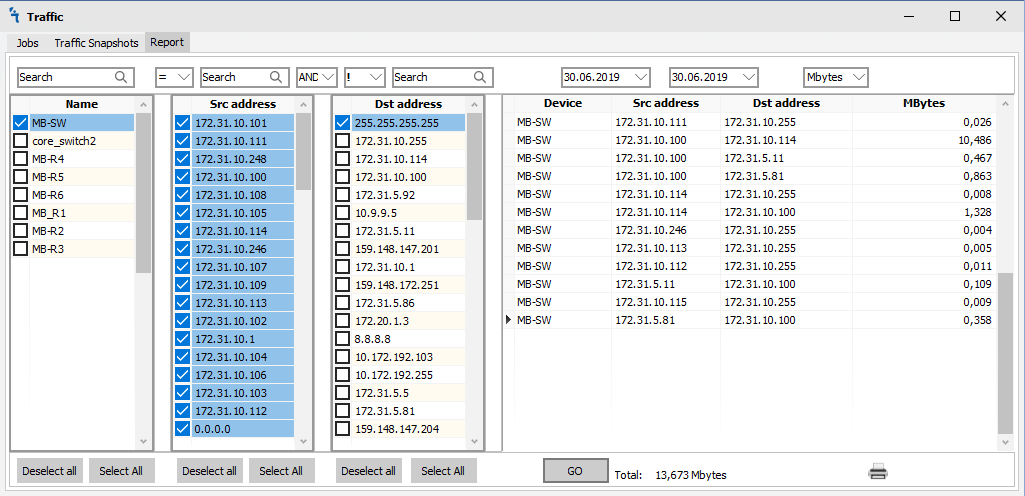
This tab is used to create reports on the accumulated data for the period.
Report toolbar
- Search - Used to quickly find a device.
- "=" or "!" - equal or unequal
- Ether "AND" or "OR" - You can use different construction of logical queries to the traffic database using logical expressions "and" or "or"
- Select date from to - to filter data by date
- Traffic in - Display traffic in Bytes, Kb, MB, GB
- Button GO - Send a query to the database to display data on the selected conditions.
 - Print a summary report.


